Running-times Excel sheets
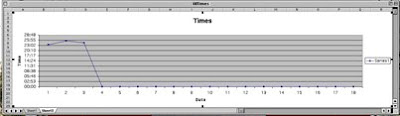
The chart. (Screenshot by the dreaded MAC.)
Well, I guess I more-or-less have my Excel doing what I wanted it to do, which was chart the ups-and-down of my running times.
As usual, whatever I did on this ‘pyooter was experimentation: try this, and see what happens. —No manual.
And vague memories of my Excel class last spring.
I try to run at the so-called elitist country-club at least twice a week; more in summer.
So far this Spring I’ve run four times.
I use my stopwatch to keep track of my running time, although I’ve lost track of my first time — which was slow anyway.
I never kept track of my times before, although my goal last year was get under 23 minutes.
I never did — snow flew, stopping my running.
So I never could compare the ups-and-downs of my running.
That would require a chart.
First I wanted to keep track of my running times, which I could do in an Excel spreadsheet.
Then I remembered, from my Excel class, that Excel could also generate a chart.
Groovy; the ups-and-downs of my running made visual.
First was the actual spreadsheet itself: only three rows, but each theoretically as long as Excel will do.
The first row is formatted as dates: i.e. each column is a date-entry.
Rows two and three are “custom” formatted to be hours-minutes-seconds; although I doubt I’ll ever be over an hour, so hours is always zero.
We noticed each cell was always reading hours first; i.e. if we entered just minutes and seconds (e.g. 24:25), it was reading 24 as midnight on a 24-hour clock.
Oh well; crank in the zero — no big deal.
The third row is sums: the sums of each column, so that blank columns total as zero. The third row will be identical to the second row, since it’s only summing that row.
Then I wanted to try the chart function; seemed doable per my Excel class.
The spreadsheet. (Screenshot by the dreaded MAC.)
I clicked the dreaded chart button.
—1) Step One: I selected the line-graph — a pie-chart wouldn’t show me what I wanted.
—2) Step Two: Select values to be charted. I tried the second row first, but that rendered a graph that didn’t show me anything.
So I selected all of the third row displayed, which currently has column-entries of zero, and that displays the chart pictured.
—3) Step Three: Name the chart (“Times”) and the X and Y axis. Okay, I forget which way X and Y go, but I see the axis names appear, so if I got ‘em backwards, we just flip-flop. I named them as “dates” and “time.”
The really groovy part is the chart updates if I add times. I tried: made up a theoretical time for the fourth column, and the chart updated. (I didn’t “save” that; since it was just an experiment.)
I still have more fiddling to do.
I have a hunch my date-axis can have the actual dates. Right now it displays the column-number.
I also recall (from my Excel-class) that the time-values can display as an actual number — probably in parentheses. Right now it shows me a dot, but not the actual time. A chart is nice to compare ups-and-downs, but it ain’t giving me the actual time.
This Excel-file will also be e-mailed to my Excel master, the guy who taught the Excel class.
We had a lotta fun.
I know I’m supposed to be a stroke-survivor, but I’d rather have fun.
We also noted it appears lots of things are happening in the background for that chart to look right. If they weren’t the chart might be almost flat — or extreme.
posted by BobbaLew at 6:54 AM
![]()


0 Comments:
Post a Comment
<< Home